
Improving Superset dashboard performance
On this page
- Where we started
- Step one: giving Superset more room to work
- Step two: adding Redis caching where it matters
- Step three: finding the expensive Snowflake work
- Step four: moving the translation join upstream
- Checking the warehouse itself
- What we deliberately did not enable
- The results
- What we learned
- Further reading
Back when I was building a client-facing analytics platform — Apache Superset dashboards backed by Snowflake, embedded in a Vue + Express.js web app — the whole thing worked well, but the dashboards were painfully slow: with average load times of ~20 seconds, making the reports mostly unusable.
There was no single setting to blame. The delay was spread across the request path — Superset's concurrency, cache misses on data we'd just served, the Snowflake queries themselves, and the burst of requests one dashboard fired off at once. So we didn't start flipping switches. We measured first, changed one thing at a time, and kept whatever improved the numbers.
Where we started
A single dashboard could issue dozens of requests — one for each chart and filter — so before changing anything, we traced what actually happens when one loads.
At the start it was about as simple as it gets: one Superset instance, a single Gunicorn worker, and every request going straight to Snowflake. A browser opens a dashboard and fires its requests; Superset runs the SQL against Snowflake and returns the results. No shared cache, no room to handle those requests in parallel — which, as it turned out, was most of the problem.
The diagram below is where we ended up, and it doubles as a map for the rest of this post: HTTP/2 from the browser, a load balancer spreading requests across two Superset instances, Redis in front of Snowflake for cache hits. Each piece is something we added deliberately, in the order the next sections walk through.
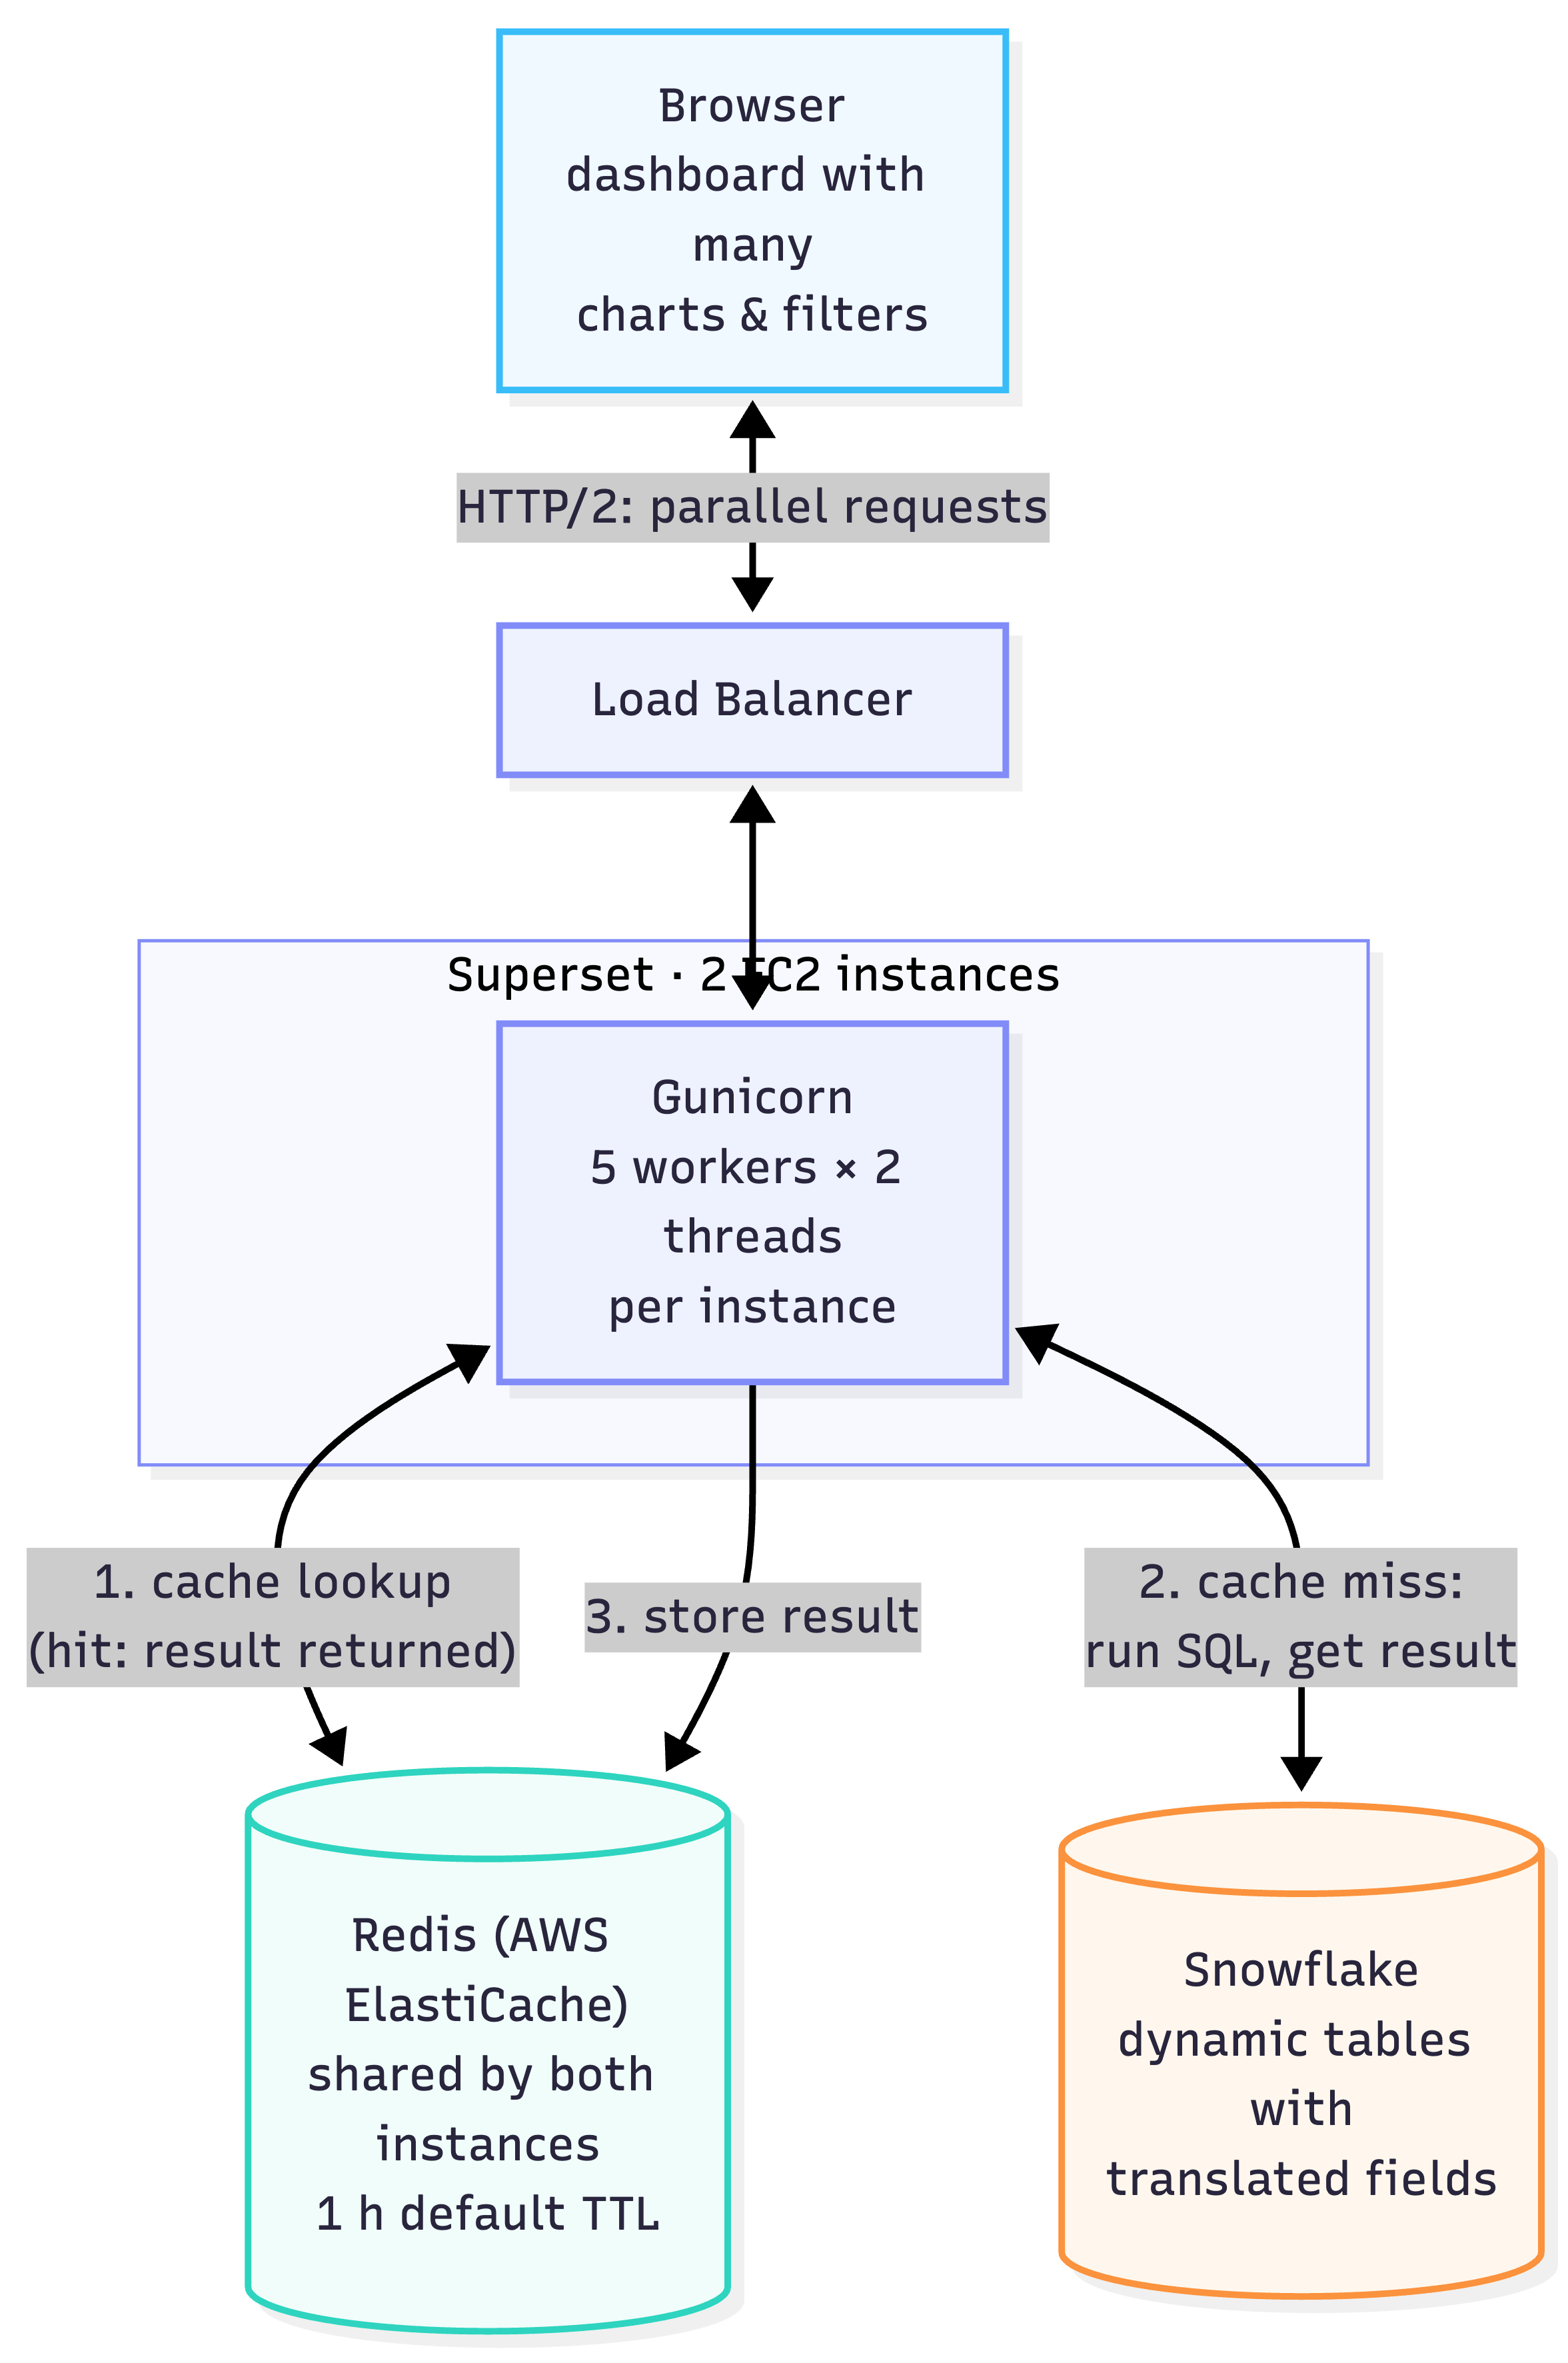
Figure 1: The request path after the changes — from a dashboard with many charts and filters to either a Redis cache hit or a Snowflake query.
Step one: giving Superset more room to work
The first bottleneck was in the application layer. A dashboard with many charts doesn't make one request, it makes many at once — one of ours issues around 18 chart requests plus its filters. With Superset's default single Gunicorn worker, those all queue for one processing lane.
We moved to two Superset EC2 instances (t4g.large), each running 5 Gunicorn workers with 2 threads apiece. Each instance has 2 vCPUs, so 5 workers follows the usual 2 × cores + 1 rule of thumb and gives ten request-handling lanes per instance instead of one. The config also set a request timeout and recycled workers:
gunicorn --bind 0.0.0.0:8088 \
  --workers 5 \
  --worker-class gthread \
  --threads 2 \
  --timeout 120 \
  --max-requests 1000 \
  --max-requests-jitter 50 \
  'superset.app:create_app()'
The max-requests flags weren't there to speed up any single query. They're a stability measure — each worker refreshes itself after about 1000 requests so slow memory growth doesn't degrade the service over a long uptime.
The protocol between browser and server mattered just as much. On HTTP/1.1 a browser opens at most six parallel connections per host, so a dashboard firing a dozen-plus requests would bottleneck in the browser no matter how many workers waited behind the load balancer. HTTP/2 multiplexes many requests over a single connection, which is what a chart-heavy dashboard actually needs. Extra workers only help if the client and network let that concurrency through.
Step two: adding Redis caching where it matters
Concurrency helps when requests are genuinely new. When they're not, caching does.
We added a Redis cache through AWS ElastiCache and pointed Superset's dashboard-data and filter-state caches at it. A cache hit came back in about 5ms, against a full Snowflake round-trip on a miss.
That cut a few recurring costs:
- Refreshing a dashboard no longer made Snowflake recompute results we'd just served.
- Filter dropdowns came from memory instead of a fresh warehouse query each — some dashboards have up to 11 filters, so that's up to 11 Snowflake queries saved on load.
- Running the cache in ElastiCache rather than on the Superset instances kept roughly 8GB of RAM on each instance free for the Gunicorn workers.
The flow was simple:
- A chart request hits Superset.
- Superset checks Redis.
- Hit: return the cached result (~5ms).
- Miss: query Snowflake, return it, and store it for next time.
We left the default cache lifetime at one hour. That number is as much a product call as a technical one — longer means more reuse, shorter means less risk of serving data that's gone stale for the use case. In our case the underlying data only changed nightly, which made an hour comfortable.
Both changes cleaned up the request-handling path, and it showed — cached dashboards now loaded fast. To see what was still slow, we traced requests with New Relic. The split was clear: cache hits came back quickly, and the time that remained sat in the uncached path, in the round-trip between Superset and Snowflake. That's where we looked next.
Step three: finding the expensive Snowflake work
So we went to Snowflake's query history. We didn't just sort by elapsed time — we pulled execution time, bytes and partitions scanned, the pruning ratio, spilling, compilation time, and whether Snowflake's own result cache had kicked in, for the fifty slowest uncached queries over a week.
Two things stood out. Most of the slow queries hit our largest table, scanning a large share of its partitions on every run. And nearly all of them carried the same translation join.
That join was getting rebuilt for every chart. Which made it an obvious thing to precompute: if the same enrichment is needed over and over, do it once upstream and expose the translated fields on the dataset instead of joining them at query time.
Step four: moving the translation join upstream
We tried it on one chart first. We measured it with the join still happening at query time, then built a dbt model materialised as a Snowflake dynamic table, with the translation labels already joined, and pointed the chart at that.
It's worth a word on why a dynamic table specifically. The analytical models don't live in the same Snowflake account as Superset reads from — they arrive through a data share from second Snowflake account where the data is ingested and transformed every night. In our analytics account we join the translation labels onto those shared models and store the result as a dynamic table, which Superset queries directly. A dynamic table keeps that precomputed join fresh on its own as new data lands, so Superset always reads a ready-made, translated dataset instead of assembling the join per query.
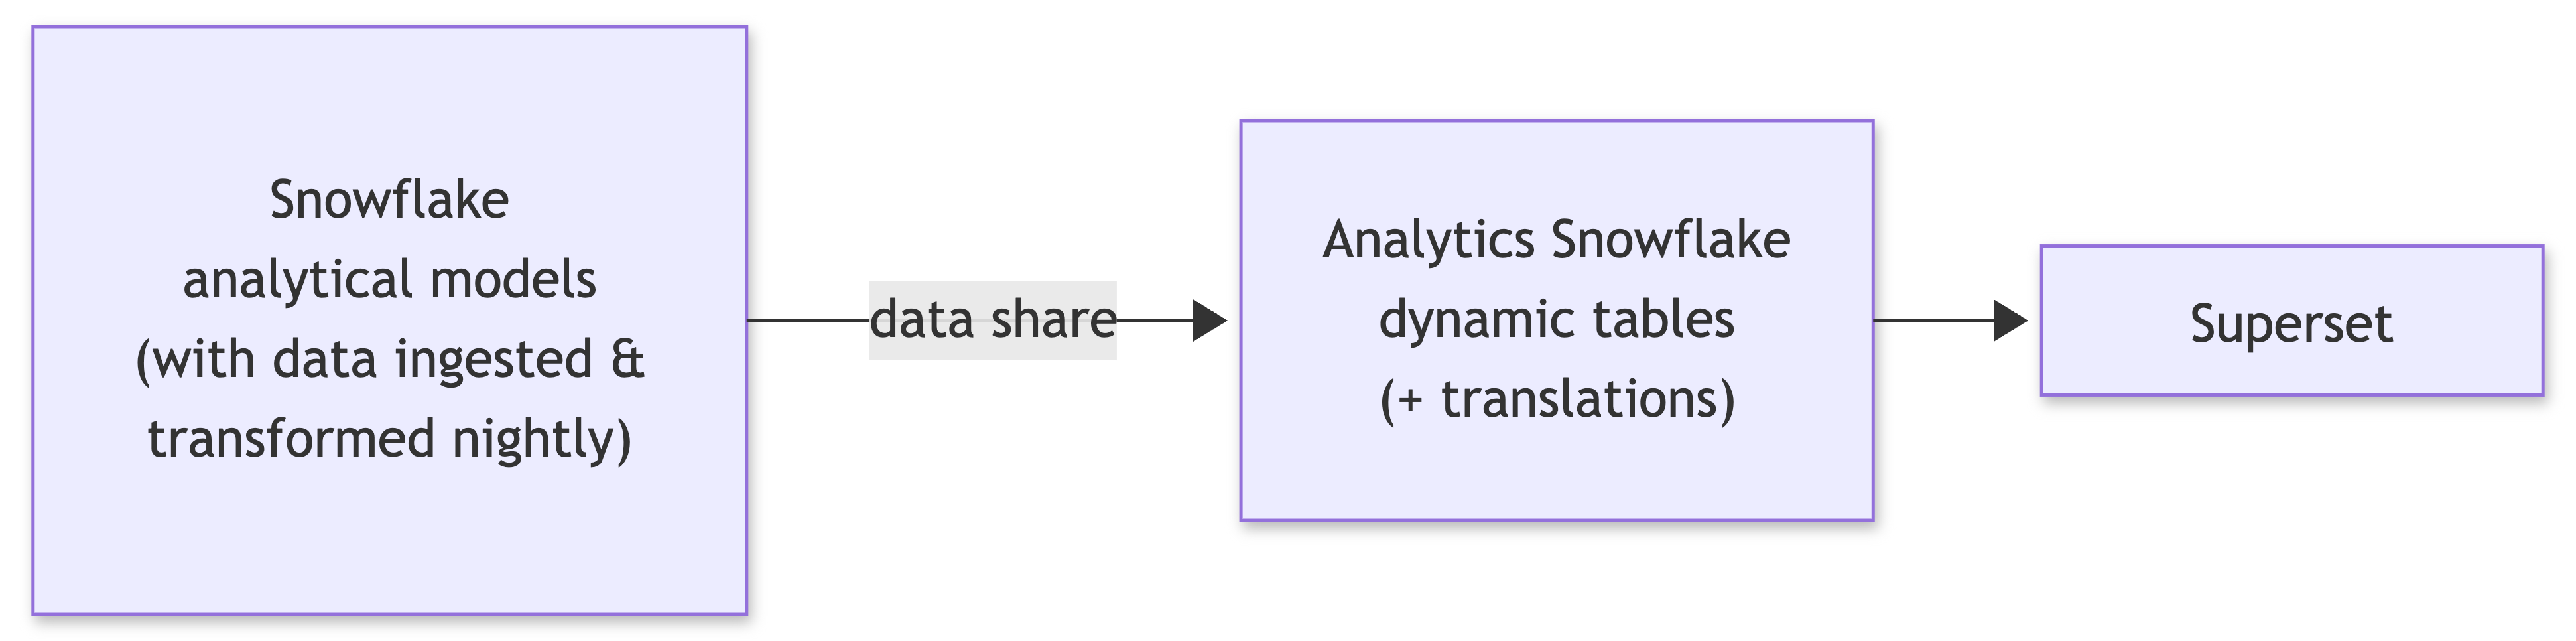
Figure 2: How the data reaches Superset — analytical models coming from the source account via a data share, get the translation join applied, and land in dynamic tables that Superset reads.
At the Superset level the difference was big:
- Average chart load dropped from 5.375s to about 2.3s — a 57.2% improvement.
- Snowflake execution time didn't drop; on the single uncached run it was 0.328s before and 0.672s after — both small enough not to read much into.
- Partitions scanned fell from 185 to 129.
The interesting part is that the chart got faster while warehouse execution didn't. That points at less query-building and compilation work in Superset rather than quicker execution in Snowflake.
Then we tested the whole dashboard. Before the change it averaged 10.66s over three runs, with a worst cold run of 21.04s. With the translated fields baked into the physical dataset it averaged 2.46s — 76.9% faster — issuing the same 13 queries either way.
The lesson: when a join rides along on every chart query, pushing it into the data model can help the user even if raw warehouse execution barely moves.
Checking the warehouse itself
While we were in the query history, we also ruled out the obvious warehouse-level suspect: was it simply undersized? Ours is a SMALL, first-generation warehouse, so it was a fair question. The evidence said no — execution times were small and there was little spilling, so a bigger warehouse would have cost more without touching a bottleneck that lived in query construction and the request path, not in raw compute.
The one warehouse setting we did change was MAX_CONCURRENCY_LEVEL, from its default of 8 to 16. It caps how many queries a warehouse cluster runs at once before the rest start queuing. This wasn't aimed at a single dashboard load — we didn't expect or measure a difference there — it was headroom for future growth, so a rising number of concurrent users wouldn't start queuing behind that limit. Raising it does split the cluster's resources across more queries, so after the change we watched disk spilling and queuing to confirm a SMALL warehouse could take the extra parallelism safely. Both stayed healthy.
What we deliberately did not enable
We looked at async queries through Celery, but ours run in seconds, not minutes or hours — a background queue would have added moving parts without touching the delay we actually had.
We also looked at Snowflake clustering. It pays off for very large tables — think a billion rows and up — where pruning saves real scan time. Our largest table is around 50 million rows, so after this consideration we decided to skip it. That may change as the data grows, but it wasn't the right next move.
The results
The dashboard we rebuilt around the materialised join went from 10.66s on average (21s on the worst cold run) to 2.46s — a 76.9% improvement on the same set of queries.
Across the whole set, measured from the web app, a full cold load was around 4–6s for almost every dashboard (about 5.5s on average, one 12s outlier), and cached reloads came back in 1–2s. Charts alone were 2–3s; filters roughly doubled that, which is why caching filter state mattered as much as caching chart data. No single fix carried every dashboard — some gained most from the materialised join, others from concurrency or cache reuse.
What we learned
Most of what stuck was about method:
- Measure the whole request path, not just the warehouse query — request tracing (APM) is what localises the bottleneck between layers.
- Fix the application and caching layers before assuming the warehouse is the problem.
- Use query history to find repeated expensive work before you touch data models.
- Materialise transformations that repeat across many chart queries.
- Match Gunicorn concurrency to the CPU you have and the dashboard's request pattern.
- Keep shared cache off the application instance where you can.
- Count browser protocol limits as part of dashboard performance.
- Don't reach for async processing or clustering unless the workload actually calls for it.
- Confirm the warehouse is the bottleneck before resizing it, and size concurrency for future load rather than a single query.
- Test cold and warm, and keep application time separate from warehouse execution time.